Periodogram
Visualize time series’ cycles, seasonality, periodicity, and most significant periods.
Inputs
Time series: Time series from the File or as output by As Timeseries widget.
In this widget, you can visualize the most significant periods of the time series.
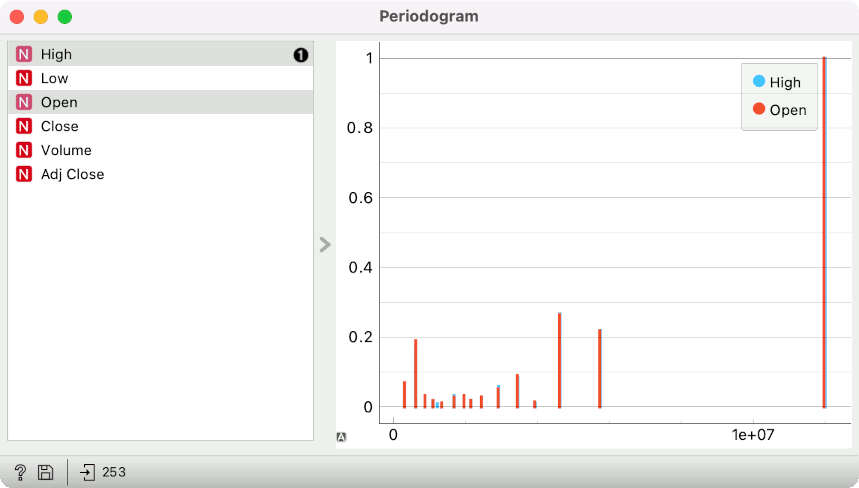
Select the series to calculate the periodogram for.
Periodogram for non-equispaced series is calculated using Lomb-Scargle method.
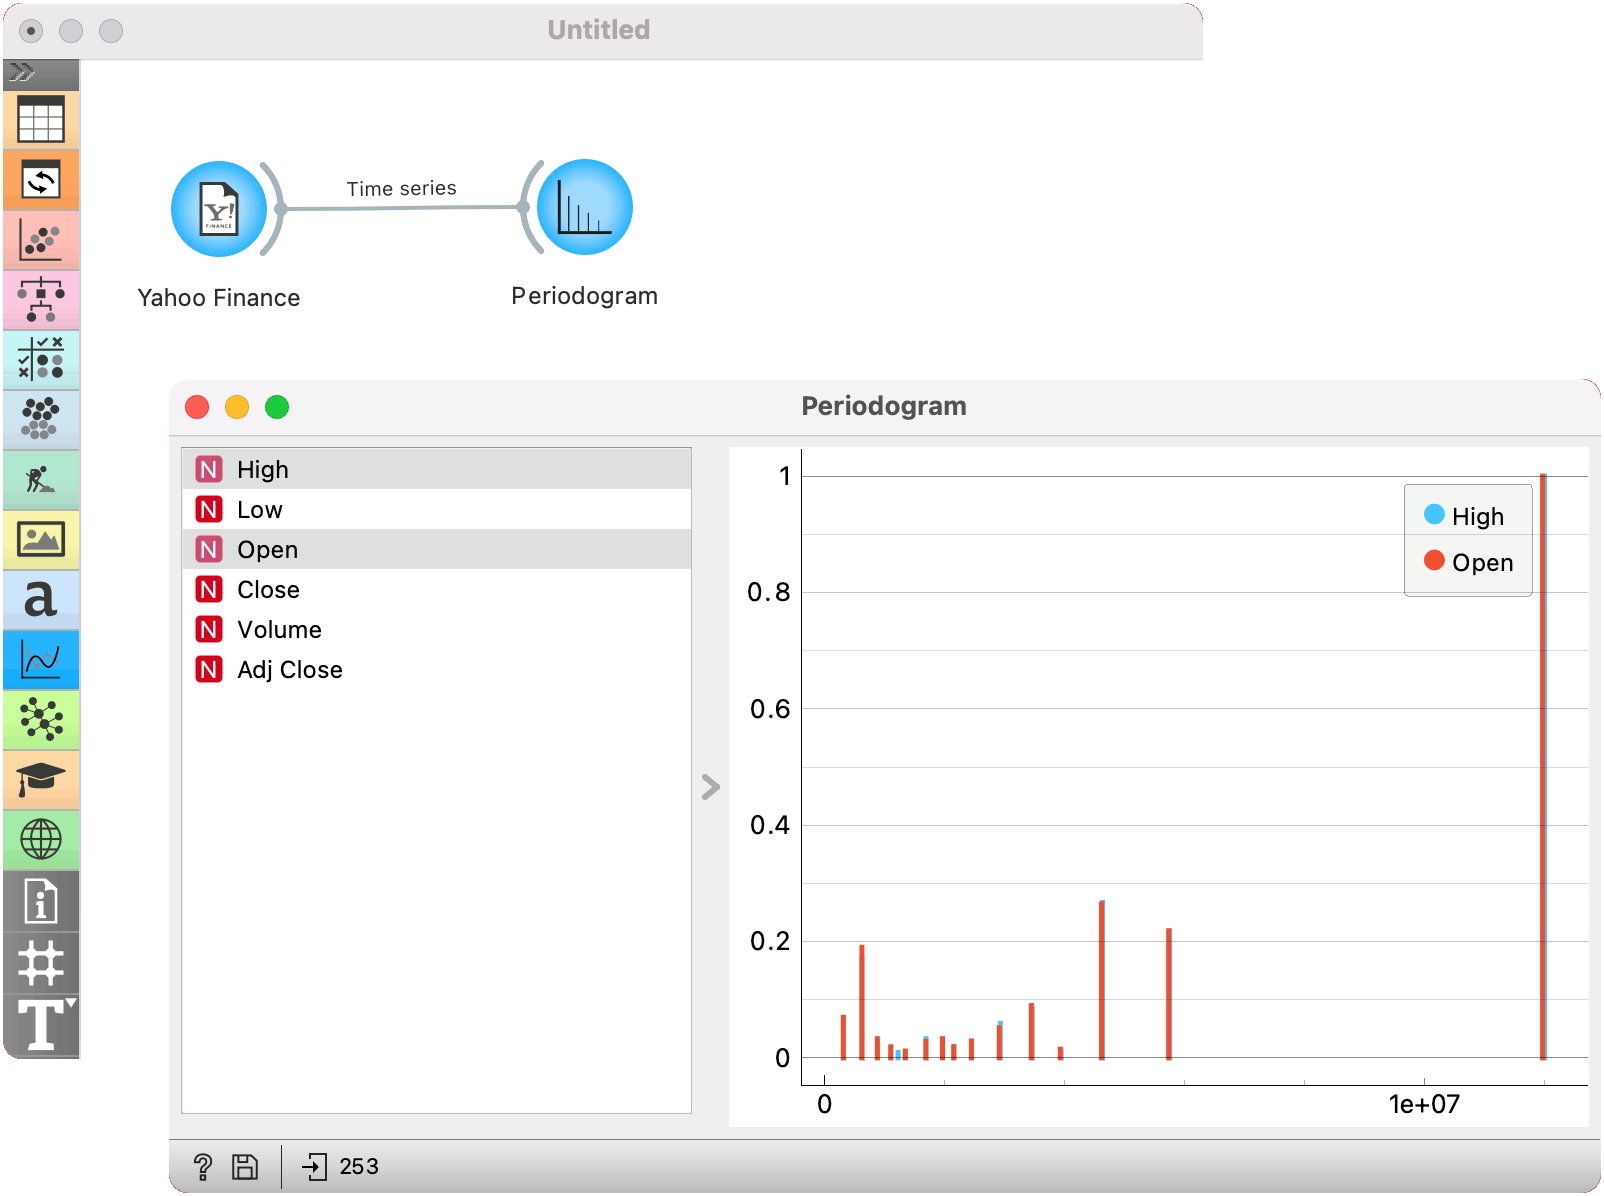
Example
Here is a simple example on how to use the Periodogram widget. We have passed the Yahoo Finance data to the widget and plotted the periodicity of Amazon stocks for the past 6 years.